process
If all of the required settings in the “source image” and “reference values” tabs are ready you can move on to the “process” tab.
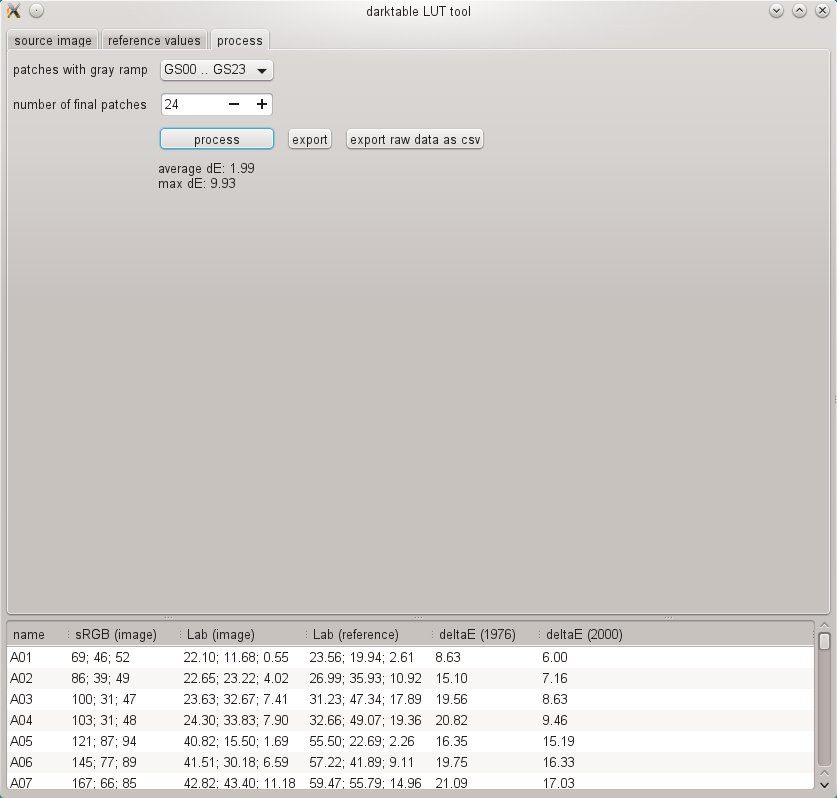
First, you need to tell darktable-chart which of the patches represents the gray ramp. In the screenshot displayed above, the gray ramp is positioned in the lower part of the color reference chart, denoted as “GS00…GS23”.
The “number of final patches” input defines how many editable color patches the resulting style will use within the color look up table module.
Click the “process” button to start the calculation.
The quality of the result (in terms of average delta-E and maximum delta-E) is displayed below the button. This data shows how closely the resulting style (when applied to the source image) will be able to match the reference values – the lower the better.
Once you are happy with the result you can click on “export” to save the generated style.
Supply a style name and a style description under which the style will later appear in darktable. darktable-chart saves the style as a .dtstyle file which can be imported into darktable and shared with others. See styles.
The “export raw data as csv” button allows you to save the extracted raw data as a CSV file for debugging purposes or later use. darktable-chart offers a command line option to produce a style with the desired number of final patches from a supplied CSV file (see darktable-chart).